Đồ thị hồi quy trên Stata
Các đồ thị hồi quy (Regression fit plots) được sử dụng để kiểm tra độ phù hợp của các biến dự đoán trong phân tích hồi quy tuyến tính. MỘt loại đồ thị hồi quy được sử dụng phổ biến nhất là đồ thị tuyến tính giữa biến kết quả dự báo với các biến giải thích. Bài viết sẽ trình bày 15 dạng đồ thị phân được sử dụng phổ biến trên phần mềm Stata.
Bảng tổng hợp 15 loại đồ thị hồi quy quan trọng được thể hiện trong 3 cột gồm: cột đầu tiên chính là loại đồ thị, cột thứ 2 bao gồm dữ liệu được sử dụng minh họa cùng với câu lệnh thực hiện trên Stata, và cột cuối cùng là minh họa kết quả thực hiện.
Để dễ dàng áp dụng các loại đồ thị nói chung trong nghiên cứu của mình, theo kinh nghiệm của bản thân, đầu tiên các bạn hình dung dạng đồ thị mong muốn của mình, kế tiếp tìm loại đồ thị gần giống nhất với đồ thị mình mong muốn (hình dạng, công dụng, kiểu biến…) và cuối cùng là copy và thay thế các biến trong câu lệnh tương ứng ở bảng bên dưới để thực hiện.
| Loại đồ thị | Cú pháp lệnh/Diễn giải | Kết quả |
| Twoway linear prediction plot | webuse auto, clear twoway lfit mpg weight |
 |
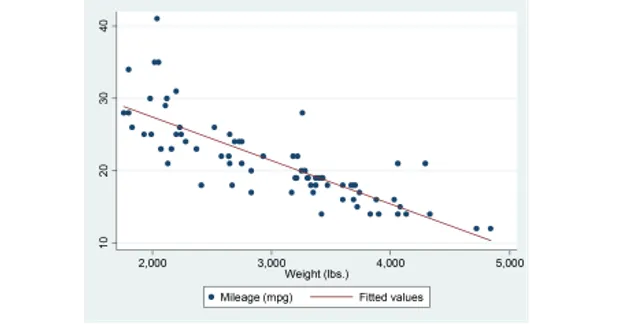
| Scatterplot with overlaid linear prediction plot | webuse auto, clear twoway scatter mpg weight || lfit mpg weight |
 |
| Scatterplot with overlaid linear prediction plot by variable | webuse auto, clear twoway scatter mpg weight || lfit mpg weight ||, by(foreign, total row(1)) |
 |
| Twoway linear prediction plot with CIs | webuse auto, clear twoway lfitci mpg weight |
 |
| Linear prediction plot with CIs with overlaid scatterplot | webuse auto, clear twoway lfitci mpg weight || scatter mpg weight |
 |
| Twoway fractional-polynomial prediction plot | webuse auto, clear twoway fpfit mpg weight |
 |
| Scatterplot with overlaid fractional-polynomial prediction plot | webuse auto, clear twoway scatter mpg weight || fpfit mpg weight |
 |
| Scatterplot with overlaid fractional-polynomial prediction plot by variable | webuse auto, clear twoway scatter mpg weight || fpfit mpg weight ||, by(foreign, total row(1)) |
 |
| Fractional-polynomial prediction plot with CIs | webuse auto, clear twoway fpfitci mpg weight |
 |
| Fractional-polynomial prediction plot with CIs with overlaid scatterplot | webuse auto, clear twoway fpfitci mpg weight || scatter mpg weight |
 |
| Twoway quadratic prediction plot | webuse auto, clear twoway qfit mpg weight |
 |
| Scatterplot with overlaid quadratic prediction plot | webuse auto, clear twoway scatter mpg weight || qfit mpg weight |
 |
| Scatterplot with overlaid quadratic prediction plot by variable | webuse auto, clear twoway scatter mpg weight || qfit mpg weight ||, by(foreign, total row(1)) |
 |
| Quadratic prediction plot with CIs | webuse auto, clear twoway qfitci mpg weight |
 |
| Quadratic prediction over scatterplot with CIs with overlaid scatterplot | webuse auto, clear twoway qfitci mpg weight || scatter mpg weight |
 |
Nguồn tham khảo: http://www.stata.com/support/