
A. long-run supply curve of housing rightward.
B. short-run supply curve of housing rightward.
C. long-run supply curve of housing leftward.
D. short-run supply curve of housing leftward.
Correct: D
2. The immediate result of the 1906 San Francisco earthquake on the housing market was to decrease
A. the short-run supply, raise rents, and decrease the equilibrium quantity.
B. housing demand, raise rents, and increase the equilibrium quantity.
C. the short-run supply, reduce rents, and increase the equilibrium quantity.
D. housing demand, reduce rents, and decrease the equilibrium quantity.
Correct: A
3. If after the 1906 San Francisco earthquake the cost of building an apartment was the same regardless of whether there were 50,000 or 150,000 apartments in existence, then the
A. long-run supply of apartments was perfectly elastic.
B. long-run supply of apartments was perfectly inelastic.
C. short-run supply of apartments was perfectly inelastic.
D. short-run supply of apartments was perfectly elastic.
Correct: A
4. After the initial decrease in supply, as part of the long-run adjustment of the housing market following the San Francisco earthquake, the
A. long-run supply curve shifted leftward.
B. short-run supply curve shifted even more leftward.
C. long-run supply curve shifted rightward.
D. short-run supply curve shifted rightward.
Correct: D
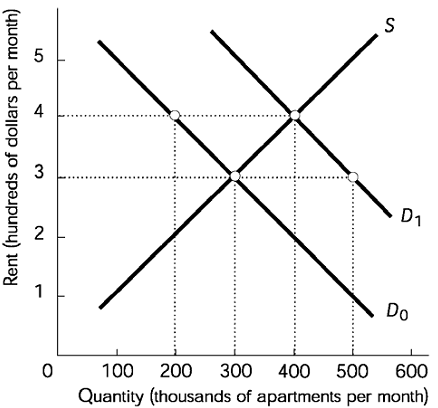
5. In the figure above, the initial demand curve is D0. There are no rent ceilings nor rent floors. Thus, the initial equilibrium monthly rent is
A. $300 per month.
B. $100 per month.
C. $200 per month.
D. $400 per month.
Correct: A
6. In the figure above, the demand curve shifts rightward from D0 to D0. There are no rent controls. In the short run, the increase in demand results in
A. lower rents and a decrease in the equilibrium quantity.
B. higher rents and an increase in the equilibrium quantity.
C. higher rents and a decrease in the equilibrium quantity.
D. lower rents and an increase in the equilibrium quantity.
Correct: B
7. In the figure above, the demand curve shifts rightward from D0 to D1 so that D1 is the relevant demand curve. Suppose the government imposes a rent ceiling of $300 per month. In the short run there will be
A. a shortage of 200,000 apartments.
B. a shortage of 500,000 apartments.
C. a shortage of 400,000 apartments.
D. no shortage nor a surplus of apartments.
Correct: A
8. In the figure above, the demand curve shifts rightward from D0 to D1 so that D1 is the relevant demand curve. Suppose the government imposes a rent ceiling of $300 per month. In the short run there will be a
A. an elimination of a black market.
B. a reduction in renters’ search activities.
C. a deadweight loss created.
D. an increased number apartments rented.
Correct: C
9. In the figure above, the demand curve shifts rightward from D0 to D1 so that D1 is the relevant demand curve. Suppose the government imposes a rent ceiling of $300 per month. In the short run there will be
A. a shortage and a decrease in search costs
B. a surplus and an increase in search costs.
C. a surplus and a decrease in search costs.
D. a shortage and an increase in search costs.
Correct: D
10) In the figure above, the demand curve shifts rightward from D0 to D1 so that D1 is the relevant demand curve. Suppose the government imposes a rent ceiling of $500 per month. In the short run there will be
A. a shortage of 300,000 apartments.
B. a surplus of apartments.
C. a shortage of 200,000 apartments.
D. neither a shortage nor a surplus of apartments.
Correct: D
11) A rightward shift of the demand curve for apartments will
A. discourage investment in buildings, thus increasing the original fall in rents.
B. discourage investment in buildings, thus increasing the original rise in rents.
C. stimulate investment in buildings, thus reducing the original rise in rents.
D. stimulate investment in buildings, thus reducing the original fall in rents.
Correct: C
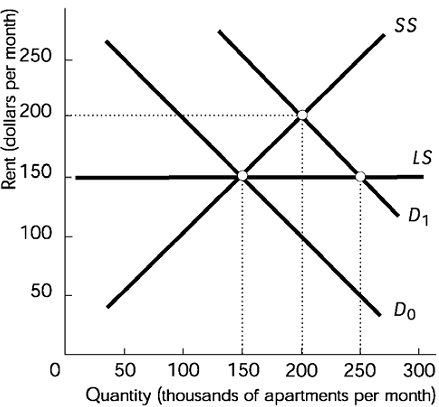
12) In the above figure, with demand given by D0, the equilibrium in an unregulated market will be
A. 250,000 rooms rented at $150
B. 150,000 apartments rented at $150.
C. 150,000 apartments rented at $200.
D. 200,000 rooms rented at $200.
Correct: B
13) In the figure above, if the demand for apartments increases from D0 to D1 and the market is unregulated, in the short run the number of apartments rented will
A. increase to 200,000 and the rent will rise to $200.
B. remain unchanged and the rent will rise to $200.
C. increase to 200,000 and the rent will remain at its initial level.
D. increase to 250,000 and the rent will rise to $200.
Correct: A
14. In the figure above, if the demand for apartments increases from D0 to D1 and the market is unregulated, in the long run the number of apartments rented will
A. increase to 200,000 and the rent will rise to $200.
B. remain unchanged from the initial quantity and the rent will rise to $200.
C. increase to 250,000.
D. increase to 200,000 and rent will be $150.
Correct: C
15. In the figure above, if the demand for apartments from D0 to D1 and there is a strictly enforced rent ceiling of $150 per apartment,
A. there will be a surplus of apartments on the market.
B. the number of rooms rented will quickly decrease by 50,000.
C. there will be a shortage of apartments.
D. the number of rooms rented will quickly increase by 50,000.
Correct: C
16. In the figure above, if the demand for apartments increases from D0 to D1 and there is a strictly enforced rent ceiling of $150 per apartment, then the new quantity supplied will be
A. less than the initial quantity supplied before the increase in demand.
B. greater than the initial quantity supplied before the increase in demand, and the rent will increase.
C. the same as the initial quantity supplied before the increase in demand.
D. greater than the initial quantity supplied before the increase in demand, but the rent will be unchanged.
Correct: C
17. The effect of a rent ceiling set above the equilibrium price
A. encourages the development of black markets.
B. is powerful, eliminating price as a regulator of quantity supplied and quantity demanded.
C. is essentially nonexistent.
D. is powerful, strengthening price as a regulator of quantity supplied and quantity demanded.
Correct: C
18. A rent ceiling below the equilibrium rent will encourage
A. a larger number of apartments rented.
B. a more efficient allocation of housing.
C. no change in the number of apartments rented.
D. increased search time and black markets.
Correct: D
19. A rent ceiling set above the equilibrium rent
A. restricts both the quantity demanded and the quantity supplied.
B. restricts the quantity demanded but not the quantity supplied.
C. restricts the quantity supplied but not the quantity demanded.
D. has no effect.
Correct: D
20) A rent ceiling set below the equilibrium price
A. restricts both the quantity demanded and the quantity supplied.
B. restricts the quantity supplied but not the quantity demanded.
C. restricts the quantity demanded but not the quantity supplied.
D. has no effect.
Correct: B
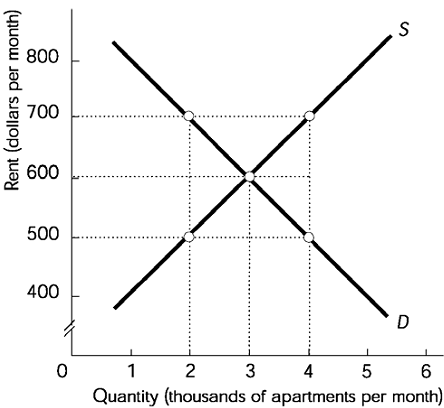
21) In the figure above, originally the apartment rental market is in short run and long run equilibrium with a rental price of $600 per month. Then the government imposes a rent ceiling of $500 per month. This will lead to a
A. shortage of 2000 apartments
B. surplus of 2000 apartments.
C. surplus of 1000 apartments.
D. shortage of 1000 apartments.
Correct: A
22) In the figure above, originally the apartment rental market is in short run and long run equilibrium with a rental price of $600 per month. Then the government imposes a rent ceiling of $500 per month, which causes a shortage. Suppose that apartments are a normal good and incomes rise. The increase in income will lead to the
A. shortage shrinking
B. shortage growing.
C. rental price increasing.
D. shortage remaining the same size.
Correct: B
23) In the figure above, originally the apartment rental market is in short run and long run equilibrium with a rental price of $600 per month. Then the government imposes a rent ceiling of $500 per month, which causes a shortage. Suppose that apartments are an inferior good and incomes rise. The increase in income will lead to the
A. shortage shrinking
B. shortage remaining the same size.
C. rental price increasing.
D. shortage growing.
Correct: A
24. In the figure above, originally the apartment rental market is in short run and long run equilibrium with a rental price of $600 per month. Then the government imposes a rent ceiling of $500 per month. Now suppose that demand increases. The increase in demand will result in the quantity supplied
A. increasing.
B. decreasing.
C. increasing, staying the same, or decreasing depending on how much demand increases.
D. staying the same.
Correct: D
25. In the figure above, originally the apartment rental market is in short run and long run equilibrium with a rental price of $600 per month. Then the government imposes a rent ceiling of $500 per month. If the law is strictly enforced, the maximum for which an apartment will rent on the black market is
A. more than $700 per month.
B. $700 per month.
C. $600 per month.
D. less than $600 per month.
Correct: B
26. In the figure above, originally the apartment rental market is in short run and long run equilibrium with a rental price of $600 per month. Then the government imposes a rent ceiling of $500 per month. The loss of producer surplus as a result of the price ceiling is
A. $500,000 per month.
B. $50,000 per month.
C. $250,000 per month.
D. more than $500,000 per month.
Correct: C
27. In the figure above, originally the apartment rental market is in short run and long run equilibrium with a rental price of $600 per month. Then the government imposes a rent ceiling of $500 per month. The loss of producer surplus
A. is smaller than the gain in consumer surplus.
B. could be smaller than, larger than, or the same size as the gain in consumer surplus.
C. is the same size as the gain in consumer surplus.
D. is larger than the gain in consumer surplus.
Correct: D
28. In the figure above, originally the apartment rental market is in short run and long run equilibrium with a rental price of $600 per month. Then the government imposes a rent ceiling of $500 per month. The deadweight loss is borne by
A. all consumers and some producers
B. all producers and some consumers.
C. the producers only.
D. the consumers only.
Correct: B
29. Effective rent controls
A. have no effect on search activity.
B. decrease search activity.
C. increase search activity.
D. shift the long-run housing supply curve rightward.
Correct: C
30. One consequence of rent ceilings is that
A. a surplus of housing units develops.
B. it makes the long-run housing supply more elastic.
C. renters are no longer exploited by landlords.
D. search costs for housing increase.
Correct: D
31. With rent controls, what mechanism might arise to bring about an equilibrium?
A. black market activity
B. more favorable leases offered to tenants
C. decreased search costs
D. increased advertising by landlords
Correct: A
32. One common effect of rent ceilings in big cities is
A. that landlords charge “key money”, high payments charged to new tenants for new locks and keys.
B. to reduce the search activity by those seeking shelter.
C. that landlords build more apartments.
D. to equalize the quantity of apartments demanded and the quantity supplied in neighborhoods.
Correct: A
33. Price ceilings in the housing market create
A. inefficiency, but lead to the building of more housing.
B. efficiency, but often cause housing to deteriorate.
C. efficiency and lead to the building of more housing.
D. inefficiency and often cause housing to deteriorate.
Correct: D
34. A price ceiling set below the equilibrium price ________ search activity and ________ the use of black markets.
A. decreases; increases
B. increases; increases
C. increases; decreases
D. decreases; decreases
Correct: B
35. The ability of workers to freely enter and leave the low-skilled labor market makes the
A. long-run supply inelastic
B. short-run supply inelastic.
C. long-run supply elastic.
D. short-run supply elastic.
Correct: C
36. In the market for low-skilled workers, labor-saving technology shifts the labor
A. demand curve leftward and lowers the wage rate.
B. demand curve rightward and raises the wage rate.
C. supply curve rightward and lowers the wage rate.
D. supply curve leftward and raises the wage rate.
Correct: A
37. In the absence of a minimum wage, a leftward shift of the supply curve
A. increases demand
B. lowers the equilibrium wage.
C. raises the equilibrium wage.
D. None of the above answers is correct.
Correct: C
38. In the short run, the supply of low-skilled labor tends to be
A. perfectly inelastic
B. perfectly elastic.
C. more elastic than in the long run.
D. less elastic than in the long run.
Correct: D
39. In the absence of a minimum wage, a decrease in the demand for low-skilled labor will ________ the wage rate when the supply of low-skilled labor is ________.
A. lower; inelastic
B. raise; inelastic
C. raise; perfectly elastic
D. lower; perfectly elastic
Correct: A
40. In the long run the supply of low-skilled labor is
A. elastic but is less elastic than in the short run.
B. elastic and is more elastic than in the short run.
C. inelastic but is more elastic than in the short run.
D. inelastic and is less elastic than in the short run.
Correct: B
41. An effective minimum wage is a priceA. ceiling that results in a surplus of low-skilled labor.
B. floor that results in a shortage of low-skilled labor.
C. ceiling that results in a shortage of low-skilled labor.
D. floor that results in a surplus of low-skilled labor.
Correct: D
42. An effective minimum wage is a price ________ that ________ the quantity of low-skilled labor demanded.
A. ceiling; decreases
B. floor; decreases
C. floor; increases
D. ceiling; increases
Correct: B
43. The intent of minimum wage laws is to
A. raise the wages of the low-skilled workers.
B. increase the quantity of labor hired.
C. lower the wages of highly skilled workers.
D. increase the incentive to work harder.
Correct: A
44. Strong minimum wage regulations
A. are favored by owners of supermarkets.
B. are favored by owners of fast-food restaurants.
C. encourage markets to adjust to change.
D. discourage markets from adjusting to change.
Correct: D
45. If the minimum wage is set above the equilibrium wage, a supply and demand diagram of the low-skilled labor market will show unemployment as
A. a horizontal distance
B. the area of a triangle.
C. a vertical distance.
D. the area of a rectangle.
Correct: A
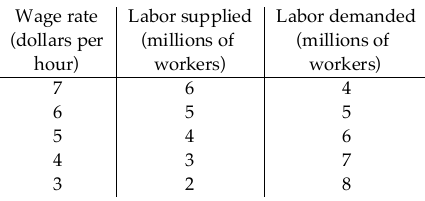
46. In the table above, what is the equilibrium wage rate in an unregulated market?
A. $6.00 per hour
B. $5.00 per hour
C. $7.00 per hour
D. $4.00 per hour
Correct: A
47. In the table above, what is the level of unemployment (in millions of workers) if the minimum wage is set at $4 per hour?
A. 1
B. 3
C. 4
D. 0
Correct: D
48. In the table above, the market is in equilibrium. Then a minimum wage is set at $7 per hour. The number of unemployed workers will be
A. 4 million
B. 0.
C. 2 million.
D. 6 million.
Correct: C
49. In the table above, the market is in equilibrium. Then a minimum wage is set at $7 per hour. The number of workers who lose their jobs will be
A. 1 million
B. 0.
C. 3 million.
D. 5 million.
Correct: A
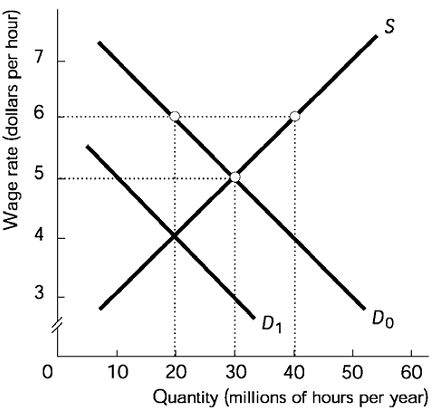
50) In the figure above, the shift from D0 to D1 could be caused by
A. imposing a minimum wage of $4.00
B. imposing a minimum wage of $5.00.
C. retraining workers.
D. introducing labor-saving technology.
Correct: D
51) In the figure above, D0 is the demand for labor curve. Imposing a minimum wage of $6 per hour will initially
A. increase employment from 20 to 40 million hours per year.
B. decrease employment from 40 to 20 million hours per year.
C. decrease employment from 30 to 20 million hours per year.
D. increase employment from 30 to 40 million hours per year.
Correct: C
52) In the figure above, D0 is the demand for labor curve. Imposing a minimum wage of $3 per hour will
A. immediately shift the demand curve to D1.
B. have no effect on the market.
C. result in unemployment.
D. result in a labor shortage.
Correct: B
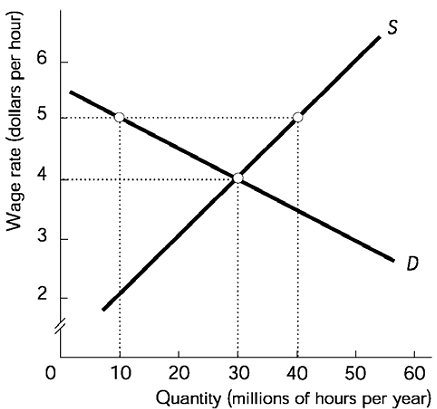
53) The market for unskilled labor is illustrated in the figure above. The market is in equilibrium when a minimum wage of $5 per hour is imposed. Employment will fall by
A. 20 million hours per year
B. 10 million hours per year.
C. 30 million hours per year.
D. 0 hours.
Correct: A
54) The market for unskilled labor is illustrated in the figure above. The market is in equilibrium when a minimum wage of $3 per hour is imposed. Employment will decrease by
A. 10 million hours per year
B. 0 hours.
C. 20 million hours per year.
D. 30 million hours per year.
Correct: B
55) The market for unskilled labor is illustrated in the figure above. The market is in equilibrium when a minimum wage of $5 per hour is imposed. Unemployment will equal
A. 10 million hours per year
B. 30 million hours per year.
C. 20 million hours per year.
D. 0 hours.
Correct: B
56. The market for unskilled labor is illustrated in the figure above. The market is in equilibrium when a minimum wage of $3 per hour is imposed. Unemployment will equal
A. 10 million hours per year
B. 30 million hours per year.
C. 0 hours.
D. 20 million hours per year.
Correct: C
57. The market for unskilled labor is illustrated in the figure above. If a minimum wage of $5 per hour is imposed, an employer who breaks the law will find a worker who is willing to work for
A. between $4 and $5 per hour.
B. less than or equal to $4 per hour.
C. more than or equal to $5 per hour.
D. None of the above because workers are not willing to supply labor.
Correct: B
58. The Fair Labor Standards Act directly
A. imposes rent ceilings
B. reduces the use of new technologies.
C. imposes price ceilings.
D. imposes minimum wages.
Correct: D
59. The Fair Labor Standards Act specifically outlaws
A. violating price ceilings
B. unregulated industries.
C. paying less than a minimum wage.
D. importing foreign goods.
Correct: C
60. In 2002 the Fair Labor Standards Act set the federal minimum wage rate at
A. $5.15 per hour.
B. $4.35 per hour.
C. $5.95 per hour.
D. $3.55 per hour.
Correct: A
61. In recent decades the federal minimum wage rate has averaged between ________ percent of the average wage for production workers.A. 10 to 20
B. 35 to 50
C. 75 to 90
D. 50 to 75
Correct: B
62. The group affected most adversely by a minimum wage law is
A. high-wage, highly skilled workers
B. low-wage, low-skilled workers.
C. middle-aged workers across wage levels.
D. older workers across wage levels.
Correct: B
63. A binding minimum wage creates
A. inefficiency because it causes too much job search.
B. efficiency because few workers lose their jobs.
C. efficiency because it increases most workers’ wages.
D. inefficiency because it decreases productive unemployment.
Correct: A
64. In general, how a sales tax is divided between buyers and sellers is determined by
A. the revenue needs of government
B. the elasticities of supply and demand.
C. monetary policy.
D. the government’s choice of whom to tax.
Correct: B
65) In general, how a sales tax is divided between buyers and sellers is determined by
A. the elasticity of supply only.
B. the elasticity of demand only.
C. both the elasticity of demand and the elasticity of supply.
D. neither the elasticity of demand nor the elasticity of supply.
Correct: C
66) The demand and the supply for a good are each neither perfectly elastic nor perfectly inelastic. Imposing a sales tax on the good is
A. paid by only sellers
B. paid by only buyers.
C. paid by both buyers and sellers.
D. paid by neither buyers nor sellers.
Correct: C
67) The price on the vertical axis of a demand-and-supply diagram is the price the consumer pays including tax. In that case, imposing a tax is shown as a shift of the
A. supply curve leftward
B. supply curve rightward.
C. demand curve rightward.
D. demand curve leftward.
Correct: A
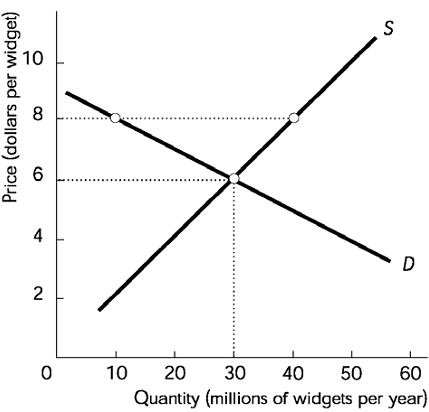
68) In the figure above, if a tax of $2 per widget is imposed, then the price of widgets paid by the buyer will be
A. between $8 and $6
B. less than $6.
C. $6.
D. more than or equal to $8.
Correct: A
69) In the figure above, if a tax of $2 per widget is imposed, then the after-tax amount per widget received by the seller will be
A. $6
B. between $8 and $6.
C. less than $6.
D. more than or equal to $8.
Correct: C
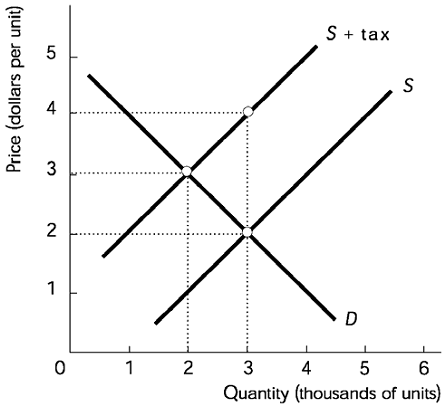
70. In the above figure, the amount of the tax per unit is
A. $1.50.
B. $1.00.
C. $0.50.
D. $2.00.
Correct: D
71. In the above figure, the amount of tax revenue is
A. $8000.
B. $4000.
C. $2000.
D. $6000.
Correct: B
72. In the above figure, the tax is divided
A. so that most of it is paid by the buyers.
B. so that neither the buyers nor the sellers pay it.
C. equally so that the buyers and sellers pay the same amount.
D. so that most of it is paid by the sellers.
Correct: C
73. In the above figure, the deadweight loss due to the tax is
A. $8000.
B. $1000.
C. $2000.
D. $4000.
Correct: B
74. The more elastic the demand for a good, the
A. more a sales tax will raise its price
B. more a sales tax will lower its price.
C. less a sales tax will lower its price.
D. less a sales tax will raise its price.
Correct: D
75. A sales tax will be divided so that
A. the sellers pay the full amount if demand is perfectly elastic.
B. the buyers pay the full amount if supply is perfectly inelastic.
C. the sellers pay the full amount if supply is perfectly elastic.
D. the buyers pay the full amount if demand is perfectly elastic.
Correct: A
76. A sales tax will be divided so that buyers pay the full amount if
A. demand is perfectly inelastic
B. supply is perfectly inelastic.
C. supply has unitary elasticity.
D. demand has unitary elasticity.
Correct: A
77) If demand is very inelastic, a sales tax will cause the tax-included price paid by buyers of the good
A. to fall by almost the amount of the tax
B. to rise by more than the amount of the tax.
C. to fall by more than the amount of the tax.
D. to rise by almost the amount of the tax.
Correct: D
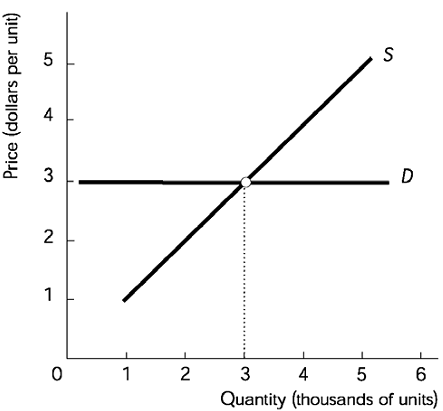
78) In the figure above, imposing a tax on the product results in a division in which
A. the buyers and sellers pay the same amount.
B. all of the tax is paid by the buyers.
C. all of the tax is paid by the sellers.
D. neither the buyers nor the sellers pay the tax.
Correct: C
79) A good has a downward-sloping demand curve and a perfectly elastic supply. Imposing a sales tax of $1 on the good
A. does not change the price paid by demanders.
B. raises the price paid by demanders by less than $1.00.
C. raises the price paid by demanders by more than $1.00.
D. raises the price paid by demanders by $1.00.
Correct: D
80) A good has a perfectly inelastic supply and a downward sloping demand curve. Imposing a sales tax of $1 on the good
A. does not change the price paid by demanders.
B. raises the price paid by demanders by more than $1.00.
C. raises the price paid by demanders by $1.00.
D. raises the price paid by demanders by less than $1.00.
Correct: A
81) A sales tax will be divided so that
A. the sellers pay the full amount if supply is perfectly inelastic.
B. the sellers pay the full amount if supply is perfectly elastic.
C. the buyers pay the full amount if supply is perfectly inelastic.
D. both buyers and sellers pay some of the tax if supply is perfectly elastic.
Correct: A
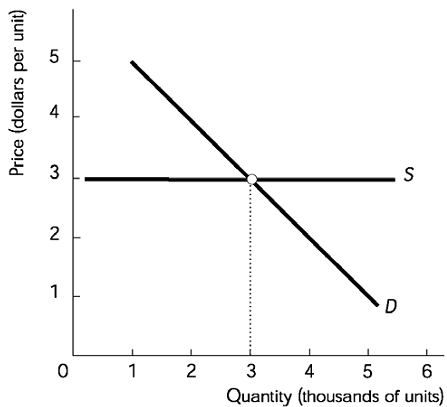
82) In the figure above, imposing a tax on the product results in a division in which
A. all of the tax is paid by the sellers.
B. all of the tax is paid by the buyers.
C. the buyers and sellers pay the same amount.
D. neither the buyers nor the sellers pay the tax.
Correct: B
83) Good A has a perfectly inelastic demand and an upward-sloping supply curve. Good B has a perfectly inelastic supply and a downward-sloping demand curve. If the same sales tax is imposed on both good A and good B,
A. the price paid by buyers of good B rises by more than the price paid by buyers of good A.
B. the price paid by buyers of good A rises by the same amount as the price paid by buyers of good B.
C. the price paid by buyers of good A rises by more than the price paid by buyers of good B.
D. More information is needed to determine whether the price paid by buyers of good A rises by more than, less than, or the same amount as the price paid by buyers of good B.
Correct: C
84) The federal government is likely to impose taxes on goods that have
A. close substitutes
B. negatively sloped supply curves.
C. high elasticity of demand.
D. low elasticity of demand.
Correct: D
85. After a $3 per-unit tax on seeing movies in theaters is imposed, attendance falls from 4,000 a week to 3,000 a week. The revenue from the tax is
A. less than $9,000 a week.
B. some amount that cannot be calculated without more information.
C. $9,000 a week.
D. between $9,000 a week and $12,000 a week.
Correct: C
86. A $10 per-unit tax on CD players raises the equilibrium price paid by consumers by $5. Before the tax, 5,000 CD players were sold per year. The revenue from the tax is
A. $50,000 per year
B. more than $50,000 per year.
C. zero.
D. positive but less than $50,000 per year.
Correct: D
87. If enforcement is aimed at buyers of an illegal good, the result will be
A. an increase in the short-run supply of the good.
B. an increase in the price of the good.
C. a decrease in demand for the good.
D. a decrease in the short-run supply of the good.
Correct: C
88. Outlawing the sale of a good shifts the supply curve
A. leftward and raises the price
B. rightward and lowers the price.
C. leftward and lowers the price.
D. rightward and raises the price.
Correct: A
89. If enforcement is aimed at sellers of an illegal good, its equilibrium price will ________ and its equilibrium quantity will ________.
A. rise; decrease
B. rise; increase
C. fall; increase
D. fall; decrease
Correct: A
90. Making the buying and selling of a good illegal shifts the demand curve ________ and shifts the supply curve ________.
A. leftward; leftward
B. leftward; rightward
C. rightward; rightward
D. rightward; leftward
Correct: A
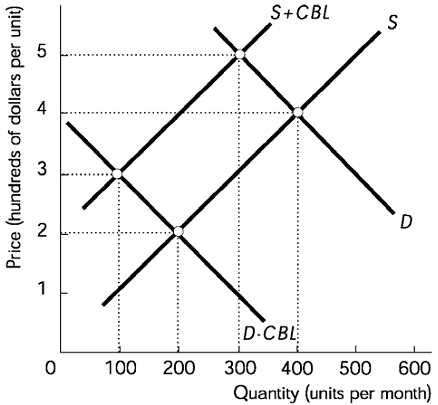
91. In the above figure, CBL is the cost of breaking the law. If it is illegal to buy, but not illegal to sell, then the price will be
A. $200.
B. $300.
C. $400.
D. $500.
Correct: A
92. In the above figure, CBL is the cost of breaking the law. If it is illegal to sell, but not illegal to buy, then the price per unit will be
A. $300.
B. $500.
C. $200.
D. $400.
Correct: B
93. In the above figure, CBL is the cost of breaking the law. If the good in the figure is made illegal and penalties are imposed on both buyers and sellers, then its price
A. will be lower than if it was not illegal.
B. will be higher than if it was not illegal.
C. will be the same as when it was not illegal.
D. can not be compared with its price when it was legal.
Correct: A
94. In the above figure, CBL is the cost of breaking the law. If it is illegal to buy and sell, then the price will be
A. $200.
B. $500.
C. $400.
D. $300.
Correct: D
95. In the above figure, CBL is the cost of breaking the law. If it is illegal to buy and sell, then the quantity of the good bought and sold will be
A. 200
B. 400.
C. 300.
D. 100.
Correct: D
96. Once farmers have harvested their crop, they have
A. strong control over the quantity supplied. Their momentary supply is inelastic.
B. almost no control over the quantity supplied. Their momentary supply is inelastic.
C. strong control over the quantity supplied. Their momentary supply is elastic.
D. almost no control over the quantity supplied. Their momentary supply is elastic.
Correct: B
97. Generally the demand for farm products is
A. perfectly inelastic.
B. inelastic but not perfectly inelastic.
C. perfectly elastic.
D. elastic but not perfectly elastic.
Correct: B
98. Most farm products have
A. inelastic demands.
B. unstable demands.
C. demand curves with positive slopes.
D. elastic demands.
1
99. If demand is inelastic, a leftward shift of the supply curve will
A. have no effect on total revenue
B. decrease total revenue.
C. shift the demand curve leftward.
D. increase total revenue.
4
100. If demand is elastic, a leftward shift of the supply curve will
A. increase total revenue
B. have no effect on total revenue.
C. decrease total revenue.
D. decrease the demand for the good.
3
A. demand is elastic
B. supply is elastic.
C. demand is inelastic.
D. supply is inelastic.
Correct: A
102. If the demand for corn is inelastic and there are no inventory holders, the total revenue from corn farming will
A. increase with a good harvest and decrease with a poor one.
B. decrease with a good harvest and increase with a poor one.
C. remain constant with either a good or a bad harvest.
D. vary by the same percentage as the price of corn.
Correct: B
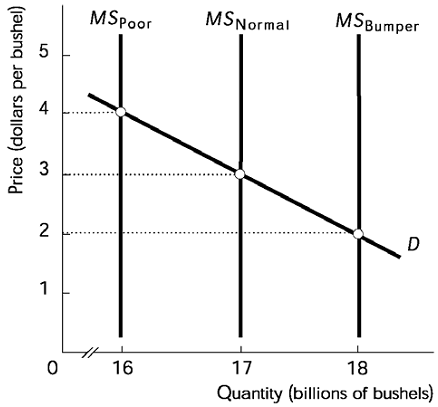
103. In the figure above, wheat farmers’ revenue will be
A. highest when there is a poor crop
B. highest when there is a normal crop.
C. highest when there is a bumper crop.
D. the same regardless of the size of the crop.
Correct: A
104. In the above figure, it is expected that the crop will be poor 25 percent of the time, normal half the time, and a bumper crop 25 percent of the time. Inventory holders will
A. buy when the price is more than $3 per bushel and sell when the price is less than $3 per bushel.
B. buy when the price is more than $5 per bushel and sell when the price is less than $2 per bushel.
C. buy when the price is less than $3 per bushel and sell when the price is more than $3 per bushel.
D. neither buy nor sell.
Correct: C
105. In the above figure, the forecast price for the future is $3 per bushel. If the cost of holding inventories is zero, then inventory holders will make the
A. supply perfectly elastic at $3 per bushel.
B. the demand perfectly inelastic at 17 billion bushels.
C. demand perfectly elastic at $5 per bushel.
D. the supply perfectly inelastic at 17 billion bushels.
Correct: A
106. In the above figure, if the government sets a production limit or quota at 16 billion bushels then
A. farmers benefit and consumers benefit
B. farmers lose and consumers benefit.
C. farmers lose and consumers lose.
D. farmers benefit and consumers lose.
Correct: D
107. In the above figure, if the government sets a price floor at $4 per bushel, then in a normal year it will need to buy up
A. 17 billion bushels
B. 0 bushels.
C. 3 billion bushels.
D. 1 billion bushels.
Correct: D
108) Storable farm products differ from perishable farm products because for storable products, inventory holders cause prices
A. to vary less and consumption to vary more.
B. to vary more and consumption to vary less.
C. and consumption to vary more.
D. and consumption to vary less.
Correct: D
109) Inventory holders normally
A. stop prices from rising a lot and from falling a lot.
B. stop prices from falling a lot, but not from rising a lot.
C. do not stop prices from rising a lot or falling a lot.
D. stop prices from rising a lot, but not from falling a lot.
Correct: A
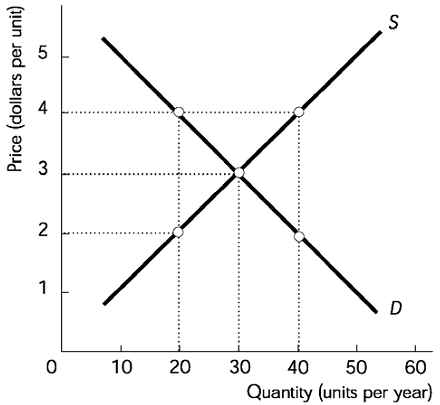
110) In the above figure, a price ceiling of $4 would
A. result in a shortage in the long run.
B. result in a surplus in the long run.
C. result in a surplus in the short run but have no effect in the long run.
D. have no effect.
Correct: D
111) In the above figure, a price ceiling of $2 would
A. have no effect
B. cause a shortage.
C. cause a surplus.
D. cause the demand curve to shift leftward.
Correct: B
112) In the above figure, a price floor of $4 would
A. cause a surplus
B. cause a shortage.
C. cause the demand curve to shift leftward.
D. have no effect.
Correct: A
113) In the above figure, a black market would emerge with a
A. price floor of $2
B. price ceiling of $4.
C. price floor of $4.
D. a rationed quantity 30.
Correct: C
114) A price floor set below the equilibrium price
A. restricts the quantity supplied but not the quantity demanded.
B. restricts the quantity demanded but not the quantity supplied.
C. restricts both the quantity demanded and the quantity supplied.
D. has no effect.
Correct: D
115) Which of the following is a likely outcome of rent ceilings?
A. black market rents below the ceiling rent
B. a surplus of rent-controlled housing
C. waiting lists of potential renters of rent-controlled housing
D. construction of more rental housing
Correct: C
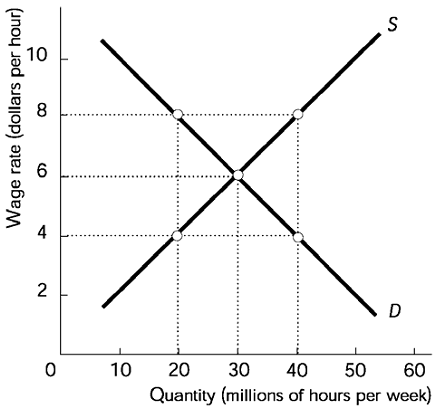
116) In the above figure, if the minimum wage is set at $8 per hour, the level of unemployment in millions of hours per week is
A. 30
B. 40.
C. 20.
D. 0.
Correct: C
117) In the above figure, if the minimum wage is set at $6 per hour, the level of unemployment in millions of hours per week is
A. 40
B. 0.
C. 20.
D. 30.
Correct: B
118) Suppose the government wants to discourage the use of cigarettes. If it imposes a tax on cigarettes, the equilibrium quantity falls the most when the elasticity of demand equals
A. 2.00
B. 0.
C. 1.00.
D. 0.50.
Correct: A
119. Suppose the government imposes a $1 tax on frisbees, and the price of a frisbee rises by $1.
A. The price rise is consistent with a perfectly elastic demand for frisbees.
B. The price could never rise this much, so this situation cannot happen.
C. The price rise is consistent with a downward-sloping supply curve for frisbees.
D. The price rise is consistent with a perfectly elastic supply for frisbees.
Correct: D
120. The less elastic the supply, the
A. larger the fraction of any tax imposed on the product that is paid by the suppliers.
B. less likely the government is to tax the product.
C. less elastic the demand.
D. less likely the government is to impose a price ceiling.
Correct: A
121. If sanctions are imposed on buyers but NOT on sellers of an illegal good, then the equilibrium price ________ and the equilibrium quantity ________.A. rises; decreases
B. falls; increases
C. rises; increases
D. falls; decreases
Correct: D
122. If there are no speculative markets in inventories, which of the following combinations would
yield the smallest price fluctuation?
A. small supply shifts and elastic demand
B. small supply shifts and perfectly elastic demand
C. small supply shifts and inelastic demand
D. large supply shifts and inelastic demand
Correct: B
123. Inventory holders
A. try to sell when the current price is higher than the expected future price.
B. do not base their sales plans on the expected future price.
C. try to sell when the current price is equal to the expected future price.
D. try to sell when the current price is lower than the expected future price.
Correct: A
124. Among the factors that create a deadweight loss and inefficiency are
A. minimum wages, but not taxes.
B. taxes, but not minimum wages or rent ceilings.
C. minimum wages, rent ceilings, and taxes.
D. rent ceilings, but not taxes.
Correct: C
125. In the market for books, initially there are no taxes on books. Books are normal goods. The government introduces a tax of $4 a book. At the same time, average income falls by $4,000 a year to $20,000 a year. Following these two changes, the equilibrium quantity of books
A. increases.
B. remains unchanged.
C. decreases.
D. either increases or decreases. We cannot say which.
Correct: C
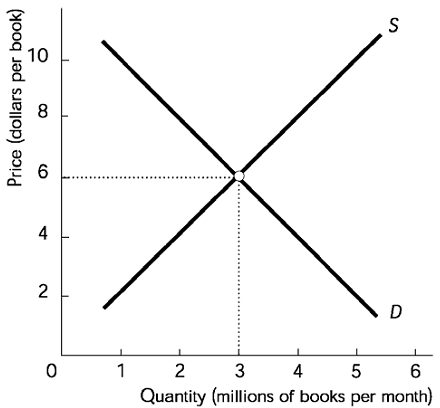
126) In the above figure, the equilibrium price of a paperback book is $6 per book and the equilibrium quantity is 3 million books. The National Literature Board convinces the government to impose a price ceiling of $3 per book. At this price, the quantity of books supplied to the market will be
A. 3 million a month and will equal the quantity demanded.
B. less than 3 million a month and will exceed the quantity demanded.
C. more than 3 million a month and will exceed the quantity demanded.
D. less than 3 million a month and will be less than the quantity demanded.
Correct: D
127) In the above figure, the equilibrium price of a paperback book is $6 per book and the equilibrium quantity is 3 million books. The National Literature Board convinces the government to impose a price ceiling of $6 per book. At this price, the quantity of books supplied to the market will be
A. 3 million a month and will equal the quantity demanded.
B. more than 3 million a month and will exceed the quantity demanded.
C. less than 3 million a month and will be less than the quantity demanded.
D. less than 3 million a month and will exceed the quantity demanded.
Correct: A
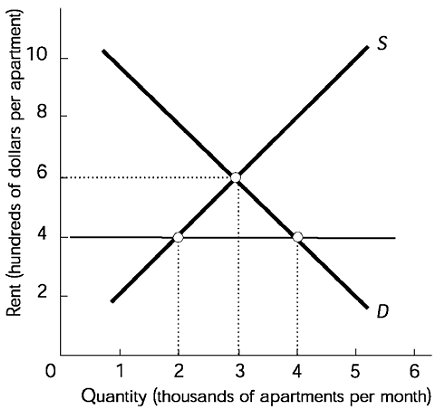
128) The figure above illustrates a rental housing market in which there is a rent ceiling of $400 a month. The rent ceiling is strictly enforced. The number of apartments rented is
A. 3 thousand
B. less than 2 thousand.
C. 4 thousand.
D. 2 thousand.
Correct: D