500 câu trắc nghiệm Kinh tế lượng – 12B

Solve the problem.
7) The Wilcoxon signed-ranks test can be used to test the claim that a sample comes from a population with a specified median. The procedure used is the same as the one described in this section except that the differences are obtained by subtracting the value of the hypothesized median from each value.
The sample data below represent the weights (in pounds) of 12 women aged 20-30. Use a Wilcoxon signed-ranks test to test the claim that the median weight of women aged 20-30 is equal to 130 pounds. Use a significance level of 0.05. Be sure to state the hypotheses, the value of the test statistic, the critical values, and your conclusion.
| 140 | 116 | 125 | 120 | 153 | 140 |
| 111 | 127 | 133 | 137 | 132 | 160 |
H0:The sample comes from a population with a median of 130 pounds.
H1:The sample comes from a population with a median different from 130 pounds.
Test statistic: T = 32.5
Critical value: 14
Do not reject the null hypothesis. There is not sufficient evidence to reject the hypothesis that the sample comes from a population with a median of 130 pounds.
Use a Kruskal-Wallis test to test the claim that the samples come from identical populations.
8) The table below shows the weights (in pounds) of 6 randomly selected women in each of three different age groups. Use a 0.01 significance level to test the claim that the 3 age-group populations of weights are identical.
| 18-34 | 35-55 | 56 and older |
| 119 | 123 | 140 |
| 134 | 147 | 128 |
| 114 | 135 | 159 |
| 125 | 110 | 134 |
| 153 | 154 | 120 |
| 138 | 163 | 116 |
Test statistic: H = 0.8158. Critical value is 9.210.
Fail to reject the null hypothesis. There is not sufficient evidence to warrant rejection of the claim that the samples come from identical populations.
Use the rank correlation coefficient to test the claim of no correlation between the two variables.
9) Given that the rank correlation coefficient, rs, for 71 pairs of data is -0.474, test the claim of no correlation between the two variables. Use a significance level of 0.05.
rs = -0.474. Critical values: rs = ±0.234.
Significant correlation. There appears to be a correlation between the two variables
10) A college administrator collected information on first-semester night-school students. A random sample taken of 12 students yielded the following data on age and GPA during the first semester.
| Age | GPA |
| x | y |
| 18 | 1.2 |
| 26 | 3.8 |
| 27 | 2.0 |
| 37 | 3.3 |
| 33 | 2.5 |
| 47 | 1.6 |
| 20 | 1.4 |
| 48 | 3.6 |
| 50 | 3.7 |
| 38 | 3.4 |
| 34 | 2.7 |
| 22 | 2.8 |
Do the data provide sufficient evidence to conclude that the variables age, x, and GPA, y, are correlated? Apply a rank-correlation test. Use \(\alpha \) = 0.05.
rs = 0.531. Critical values: rs = ±0.591. (Ranking both variables from lowest to highest).
No significant correlation. The data do not provide sufficient evidence to indicate that age and GPA are correlated
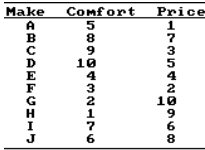
11) Ten luxury cars were ranked according to their comfort levels and their prices.

Find the rank correlation coefficient and test the claim of no correlation between comfort and price. Use a significance level of 0.05.
rs = -0.285. Critical values: rs = ±0.648.
No significant correlation. There does not appear to be a correlation between comfort and price
Use the runs test to determine whether the given sequence is random. Use a significance level of 0.05.
12) The outcomes (odd number or even number) of a roulette wheel are shown below. Test for randomness of odd (O) and even (E) numbers.
O E O E O E O E E O E E
E E O E O O E O E E O E
n1= 10, n2= 14, G = 18, 5% cutoff values: 7, 18.
Reject the null hypothesis of randomness.
13) Use a 0.05 level of significance to test the claim that the sequence of computer-generated numbers is random. Test for randomness above and below the mean.
8 7 5 7 3 9 1 8 0 4 3 8 4 6 2 3 9 7 5
n1= 9, n2= 10, G = 14.
Test statistic: G = 14. Critical values: 5, 16.
Fail to reject the null hypothesis of randomness.
14) Test the sequence of digits below for randomness of odd and even digits.
| 0 | 4 | 7 | 3 | 6 | 0 | 9 | 7 | 4 | 8 |
| 7 | 2 | 8 | 5 | 7 | 3 | 9 | 6 | 4 | 6 |
| 4 | 7 | 9 | 1 | 6 | 1 | 9 | 5 | 8 | 3 |
| 7 | 8 | 5 | 7 | 3 | 5 | 2 | 9 | 3 | 8 |
n1= 17, n2= 23, G = 19, \({\mu _G}\) = 20.550, \({\sigma _G}\) = 3.0494.
Test statistic: z = -0.51. Critical values: z = ±1.96.
Fail to reject the null hypothesis of randomness.
MULTIPLE CHOICE. Choose the one alternative that best completes the statement or answers the question.
Solve the problem.
15) When performing a rank correlation test, one alternative to using Table A-9 to find critical values is to compute them using this approximation:
\({r_s} = \pm \sqrt {\frac{{{t^2}}}{{{t^2} + n – 2}}} \)
where t is the t-score from Table A-3 corresponding to n – 2 degrees of freedom. Use this approximation to find critical values of rs for the case where n = 11 and \(\alpha \) = 0.01.
○ ± 0.685
○ ± 0.726
● ± 0.735
○ ± 0.411