500 câu trắc nghiệm Kinh tế lượng – 2A

Tổng hợp 500 câu trắc nghiệm + tự luận Kinh tế lượng (Elementary Statistics). Tất cả các câu hỏi trắc nghiệm + tự luận đều có đáp án. Nội dung được khái quát trong 13 phần, mỗi phần gồm 3 bài kiểm tra (A, B, C). Các câu hỏi trắc nghiệm + tự luận bám rất sát chương trình kinh tế lượng, đặc biệt là phần thống kê, rất phù hợp cho các bạn củng cố và mở rộng các kiến thức về Kinh tế lượng. Các câu hỏi trắc nghiệm + tự luận của phần 2A bao gồm:
SHORT ANSWER.
Write the word or phrase that best completes each statement or answers the question. Identify as many similarities and differences that you can find.
1) Suppose that a data set has a minimum value of 28 and a maximum value of 73 and that you want 5 classes. Explain how to find the class width for this frequency distribution. What happens if you mistakenly use a class width of 9 instead of 10?
For the given data, the class width is 9, since that value is the range, 73 – 28, divided by the number of classes. However, the quotient should always be rounded up, even when a whole number results. If 9 were mistakenly used as the class width, the last datum, which is 73, would be cut off the distribution because the upper limit of the fifth class is 72. More data would be cut off, if the class start was below
28.
2) A company advertises an average of 42,000 miles for one of its new tires. In the manufacturing process there is some variation around that average. Would the company want a process that provides a large or a small variance? Justify your answer.
Answers will vary
Use the range rule of thumb to solve the problem.
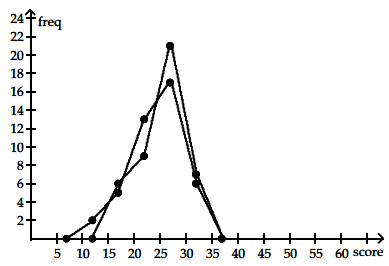
3) The data shows the roundtrip mileage that 43 randomly selected professors and students drive to school each day. Graph the frequency polygons and determine whether there appears to be any significant difference between the two groups.
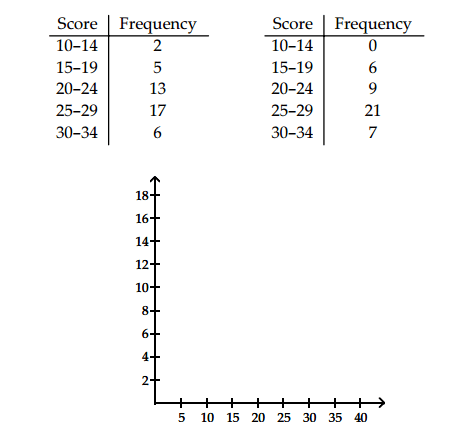
There does not appear to be a significant difference
MULTIPLE CHOICE. Choose the one alternative that best completes the statement or answers the question.
Use the pie chart to solve the problem.
4) The pie chart shows the percent of the total population of 12,200 of Springfield living in the given types of housing. Round your result to the nearest whole number.
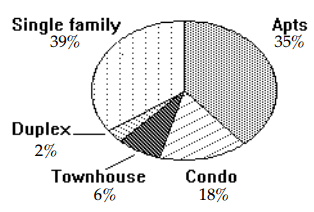
Find the number of people who live in single family houses.
● 4758 people
○ 39 people
○ 5368 people
○ 7442 people
Use the range rule of thumb to solve the problem.
5) Six college buddies bought each other Christmas gifts. They spent:
$236.88 $150.51 $154.55
$299.92 $290.97 $251.46
What was the mean amount spent? Round your answer to the nearest cent.
○ $264.86
● $230.72
○ $346.07
○ $276.86
Find the median for the given sample data.
6) The number of vehicles passing through a bank drive-up line during each 15-minute period was recorded. The results are shown below. Find the median number of vehicles going through the line in a fifteen-minute period.
23 25 23 26
26 23 28 25
33 29 29 27
22 29 23 18
13 25 25 25
○ 26
○ 29
● 25
○ 24.85
7) Find the mode(s) for the given sample data: 79, 25, 79, 13, 25, 29, 56, 79
● 79
○ 48.1
○ 42.5
○ 25
8) The weights (in ounces) of 18 cookies are shown. Find the mid range.
0.68 1.29 0.93 1.02 0.74 1.43
1.29 1.20 0.68 1.46 1.33 1.14
1.33 1.46 0.74 1.33 1.02 0.93
● 1.070
○ 1.14
○ 1.100
○ 1.055
Use the range rule of thumb to solve the problem.
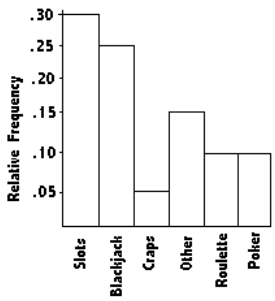
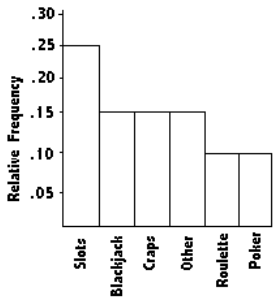
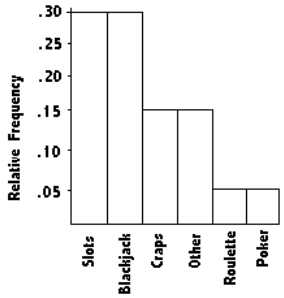
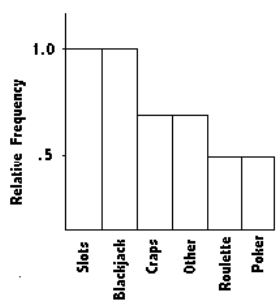
9)100 casino patrons, were interviewed as they left the casino. 30 of them said they spent most of the time playing the slots. 30 of them said they played blackjack. 15 said they played craps. 5 said roulette. 5 said poker. The rest were not sure what they played the most. Select the Pareto chart that displays these findings.
○ 
● 
○ 
○ 